Predictive identification of thermal anomalies for the protection of critical assets.









Our methodology transforms complex thermal data into secure decisions. We apply rigorous global quality standards to deliver technical compliance and absolute reliability in every inspection.
At DRONE & GIS, we conduct spatial data engineering through workflows that integrate automation, computer vision, and non-negotiable technical precision. We design bespoke acquisition architectures for mission-critical operations, ensuring that radiometric resolution, thermal sensitivity, and positional accuracy exceed the most demanding international standards in engineering and predictive maintenance.
Radiometric Thermal Sensing: Integration of highly sensitive thermal cameras, rigorously calibrated to measure the absolute temperature of each pixel.We combined this technology with RGB photogrammetry to ensure double and detailed coverage, allowing for the precise overlay of the heat map onto the actual image of the asset..
Industrial-Grade Instrumentation: Deployment of state-of-the-art enterprise Drones, equipped with multi-sensor systems and dual-frequency GNSS receivers (RTK/PPK). This ensures the absolute, millimetre-level georeferencing of every hotspot or thermal anomaly detected in the field.
Thermographic Processing Intelligence: Application of advanced algorithms and cloud-based artificial intelligence to classify temperature deltas. We transform raw radiometric data into Thermal Digital Twins and high-fidelity inspection reports, providing exact diagnostics for immediate decision-making and failure prevention.
Through the systematic capture of images in the far-infrared spectrum (LWIR), we generate continuous and rigorously georeferenced thermal orthomosaics..
Our cartographic methodology ensures the positional precision and thermal accuracy necessary for advanced geospatial analyses, allowing for the precise spatial representation of temperature gradients across vast territorial areas for direct and native integration into GIS environments..
This solution is essential for mapping urban heat islands, monitoring dispersion plumes in water bodies, conducting large-scale water stress analysis, or mapping soil moisture..
The data is processed following rigorous standards to provide a synoptic view of the surveyed area, serving as a fundamental resource for strategic decision-making in engineering and global environmental management..
Identifying thermal anomalies before they become critical problems is the main advantage of thermal imaging. By revealing temperature variations and patterns that are completely invisible to the naked eye, this technology allows for a predictive approach to operations. This makes it possible to anticipate structural or equipment failures, preventing unscheduled interruptions, minimizing accidents, and ensuring a high level of operational safety.
Whether it's the rapid identification of faults in electrical infrastructure and solar parks, the analysis of water stress for precision agriculture, or the mapping of urban heat islands, our drones capture the exact thermal signature of the terrain. Using highly sensitive radiometric sensors mounted on state-of-the-art aircraft, it's possible to scan extensive areas in a short period, ensuring meticulous data collection that meets the most demanding market standards.
The processing results in high-resolution thermal orthomosaics and rigorous 3D thermographic models, providing highly accurate technical and spatial insights. These cartographic products offer a synoptic and integrated perspective of the mapped area, essential for optimizing maintenance plans, drastically reducing the operational costs of traditional field inspections, and robustly supporting environmental management and engineering projects.
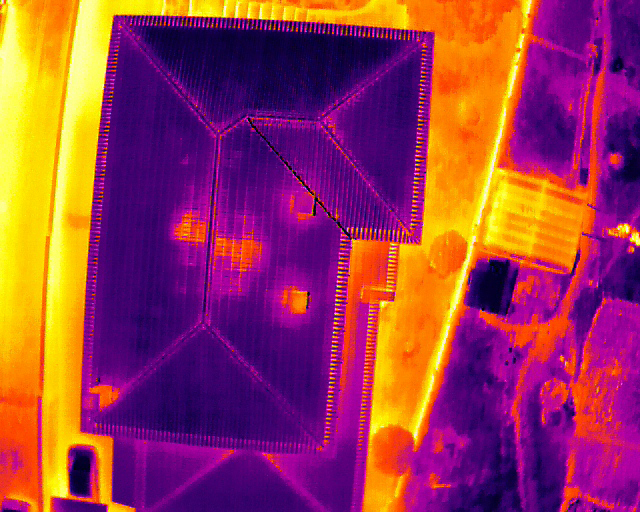
Urban Heat Island (UHI) Mapping: Creation of thermal maps for neighbourhoods or entire cities to identify overheating zones, assisting public authorities in planning urban afforestation and zoning modifications.
Large-Scale Energy Efficiency: District-wide thermal surveys to map heat loss through the roofs of large residential or industrial complexes, generating energy dissipation maps.
Identification of Springs and Groundwater: Groundwater typically has a different temperature than surface soil. Continuous mapping allows for the identification of shallow water tables, hidden springs, or seepage zones.
Mapping Thermal Plumes in Bodies of Water: Generating maps that show the flow and dispersion of industrial effluents, illegal sewage, or cooling water from power plants as they enter rivers and oceans.
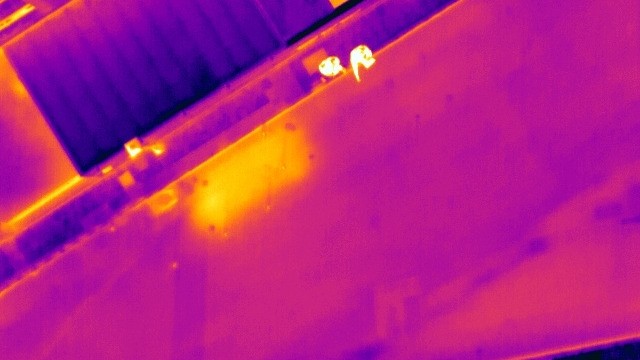
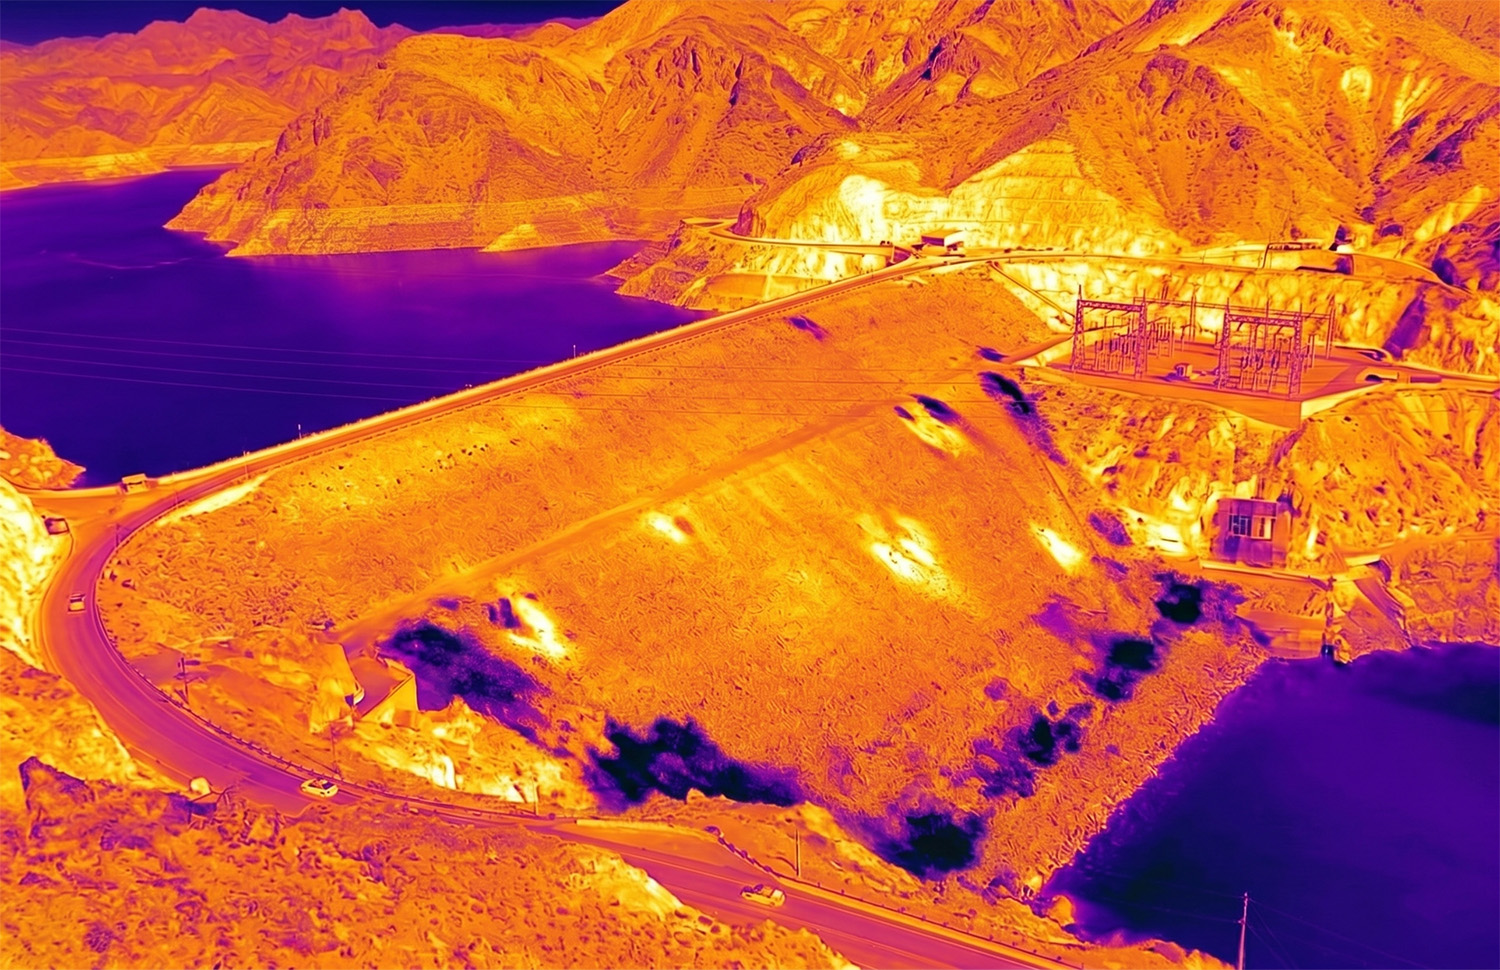
Moisture Mapping in Dams: Zones with higher water saturation in earth or tailings dams exhibit distinct thermal signatures (generally cooler during the day). Thermal orthomosaics allow mapping of these moisture patches, which are crucial indicators of geotechnical stability, before they become visible problems.
Monitoring of Ore Stockpiles (Spontaneous Combustion): In coal mines or certain types of tailings, continuous thermal mapping of large pits creates a cartographic record of soil heating zones, preventing fires.
Mapping of Water Stress and Microclimates: Generation of maps that correlate canopy temperature with plant transpiration rate. Warmer areas indicate water deficiency, allowing for precise mapping for irrigation zoning and watershed management.
Forest Fire Prevention (Risk Mapping): Mapping forest areas to identify zones of extreme dryness and biomass accumulation with high temperatures, creating fire susceptibility maps.
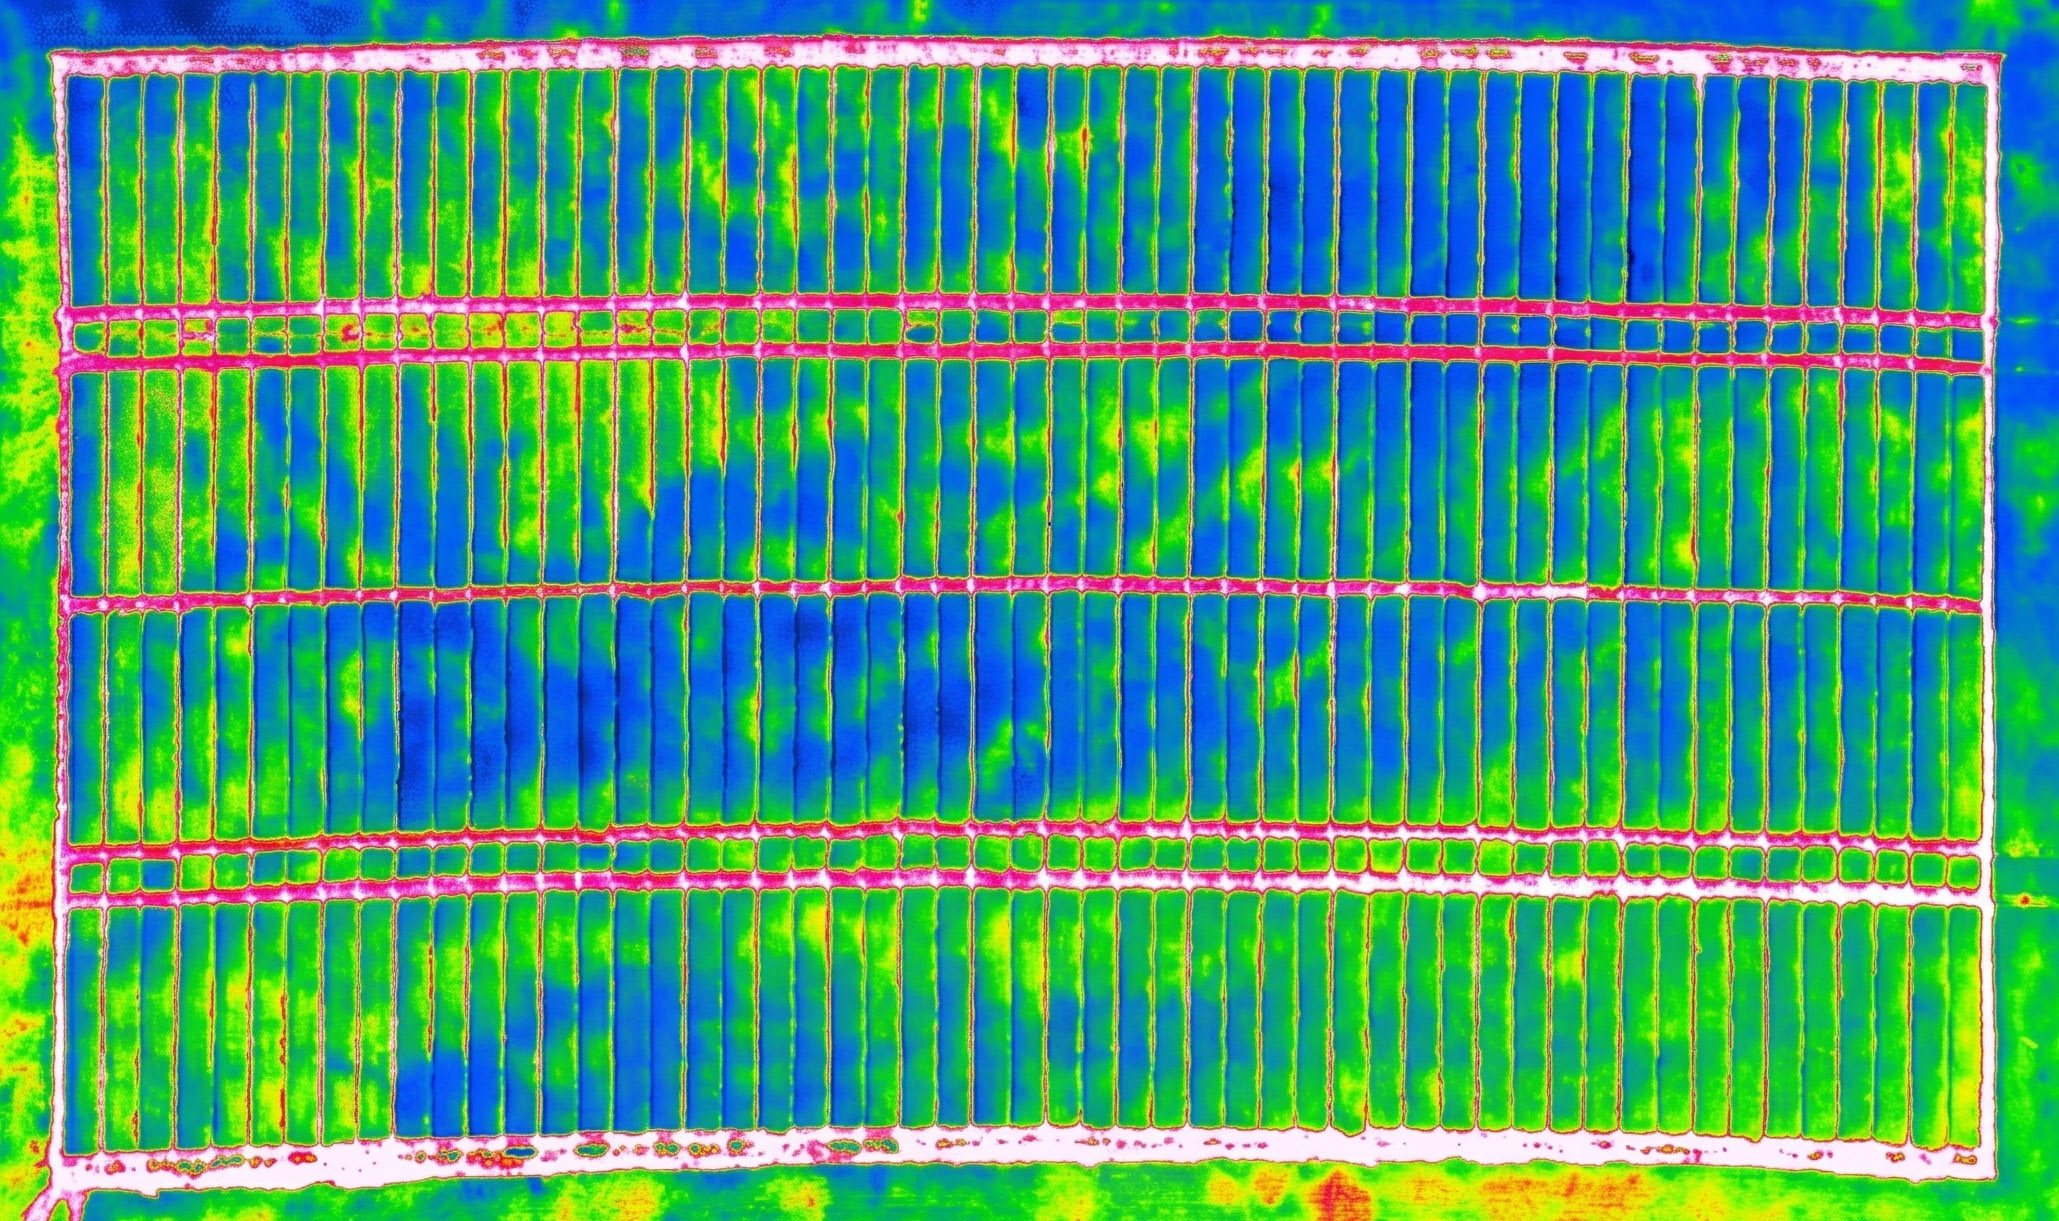
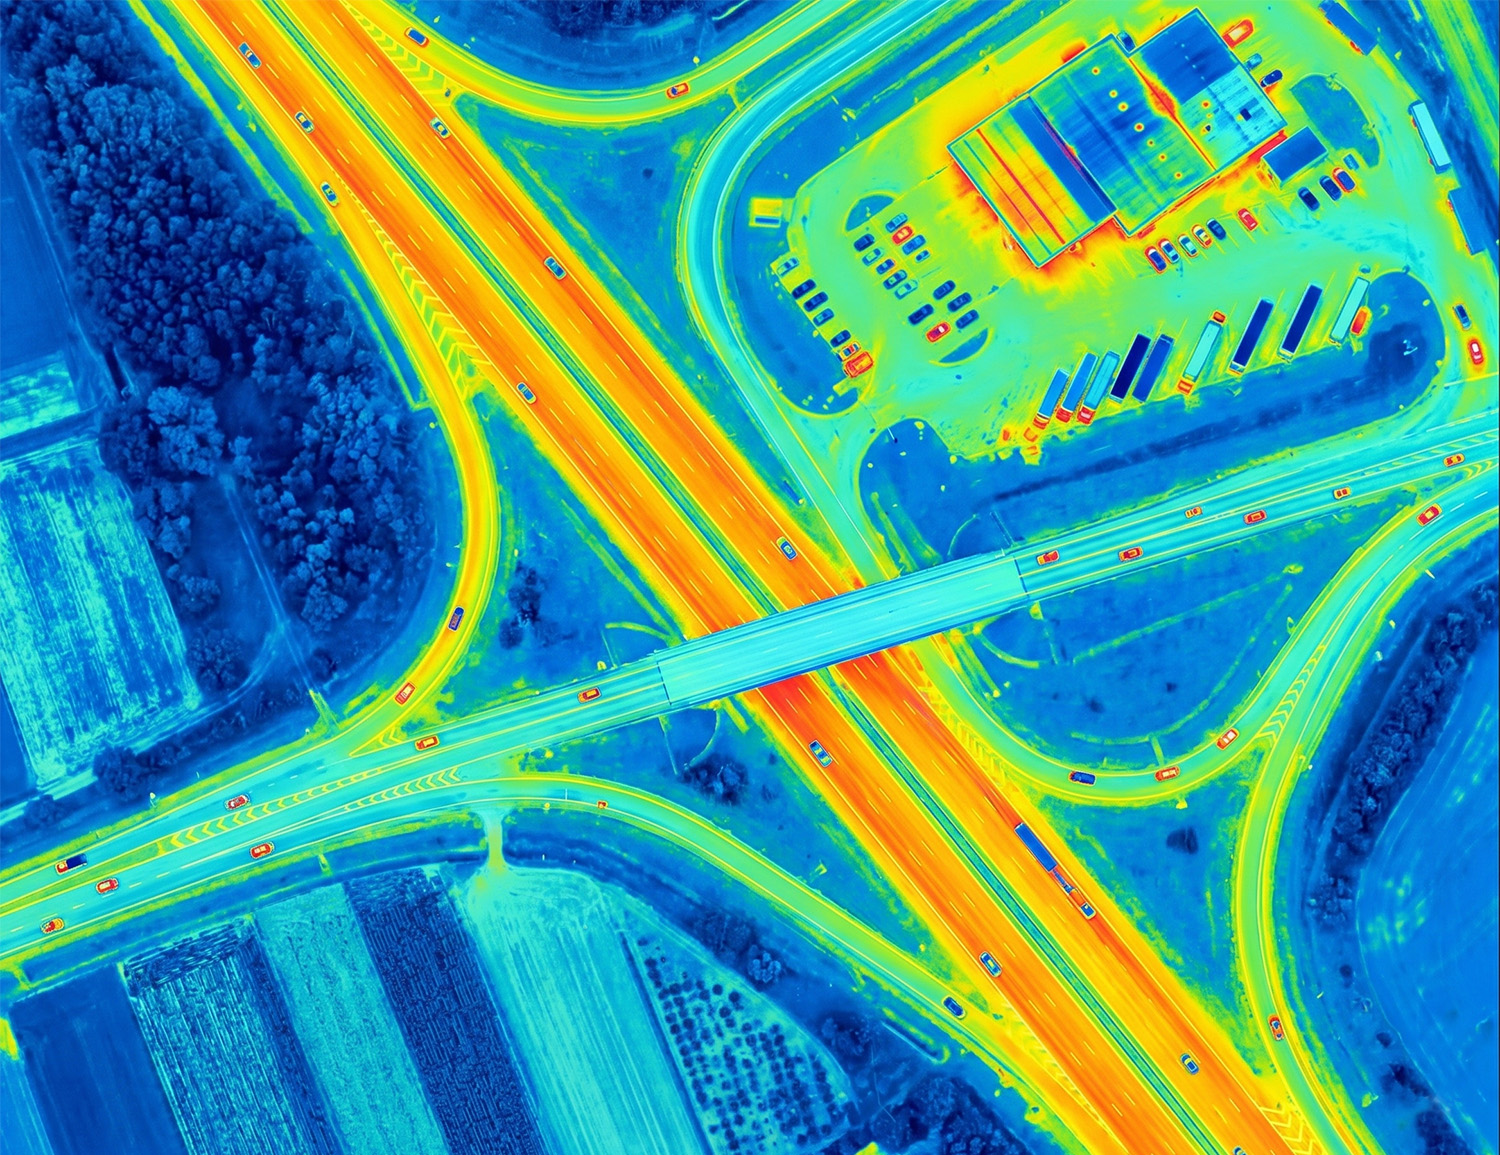
Thermal Mapping of Pavements: Mapping large stretches of highways or airport runways (thermal aerial photogrammetry) to identify, through temperature contrast, areas with moisture retention in the subgrade, asphalt delamination, or pockets of water below the surface, assisting in risk mapping of the road network.
